Services
The virtual appliance has internal services that are required for operation.
There are system-wide services, and services specific to transcription workers for a given language.
For the Batch Virtual Appliance, this table lists the services:
| Service Name (Begins with) | Description | Required Status |
|---|---|---|
| batch_ffmpeg... | Conversion of audio | Running |
| batch_rpc_gateway... | RPC endpoint | Running |
| batch_license... | Licensing service | Running |
| batch_linkerd... | Internal Networking | Running |
| batch_notifier... | Callback function | Running |
| batch_management... | Management functions | Running |
| batch_rabbitmq... | Job Queue | Running |
| batch_monitoring_ui... | Monitoring Web GUI | Running |
| batch_cron... | Completed job clean-up | Running |
| batch_v1compatibility... | V1 REST API | Running |
| batch-jobs... | Used to perform ASR and transcription | Running |
| batch_nginxlb... | HTTP gateway | Running |
The service will always have a current state, these states include:
| Service Status | Description |
|---|---|
| running | Service has started and is running |
| created | Service is in the process of starting |
| exited | Service has stopped and is no longer running |
Service status
This can be used to ensure all services have the required status to operate (see table above). Example: GET to list services and corresponding status:
curl -L -X GET 'http://${APPLIANCE_HOST}:8080/v1/management/services' \
    -H 'Accept: application/json' \
    | jq
If the appliance has been licensed then you will see a return like this (for the Batch Virtual Appliance):
{
  "service_status": [
    {
      "service": "batch_management.1.iu9c86o1weubdmi99wddlcklr",
      "status": "running"
    },
    {
      "service": "batch_ffmpeg.1.jre8d5lempzmsqfki9o871a62",
      "status": "running"
    },
    {
      "service": "batch_notifier.1.idqxysv0srzeg2vkkorh1zjfh",
      "status": "running"
    },
    {
      "service": "batch_linkerd.1.af4t03setx3m64s15s9yawysl",
      "status": "running"
    },
    {
      "service": "batch_batch-cron.1.y5ql8ryyqlxwlxy84q9q3lfrn",
      "status": "running"
    },
    {
      "service": "batch_license.1.7ecytnlzd6hso3jxauvbyvfyi",
      "status": "running"
    },
    {
      "service": "batch_rabbitmq.1.l8ny2q6b2xhz0yr5bxwodbtog",
      "status": "running"
    },
    {
      "service": "batch_monitoring_ui.1.v180r4tq7dlcbfhc3vxyukpdo",
      "status": "running"
    },
    {
      "service": "batch_rpc_gateway.1.fb3ryh2a4d41sy628bhiogyx4",
      "status": "running"
    },
    {
      "service": "batch_postgres.1.wfy284tvznpnmgi22xaw11b55",
      "status": "running"
    },
    {
      "service": "batch_jobs.1.z4vftf8vv42uzmxd4ra3235ao",
      "status": "running"
    },
    {
      "service": "batch_v1compatibility.1.j5rvj3wpqwdfnl848ci42iix2",
      "status": "running"
    }
  ]
}
Note: After a service is restarted it will have a random string identifier post fixed to its name.
Service restart
If required for troubleshooting you may need to restart all the services. During the restart, all transcription will stop. The following command performs a service restart:
$ curl -X DELETE 'http://<APPLIANCE HOST>:8080/v1/management/services' \
    -H 'Accept: application/json'
Access Logs
The individual services on the system provide log files that can be collected to help with troubleshooting. The service name will need to be provided when retrieving logs. See above for instructions on how to view the names of the running services
The following parameters are available when accessing logs:
| Name | Description | Required Status |
|---|---|---|
| name | Name of the service to collect the logs for | Required |
| count | Number of log lines wanted, defaults to 100; if all lines are to be returned set to -1 | Optional |
Example: GET to retrieve logs for batch_monitoring_ui service:
curl -L -X GET 'http://${APPLIANCE_HOST}:8080/v1/management/logs/batch_monitoring_ui.1.mtvn0r47qb7durnl0fmuimsc0' \
    -H 'Accept: application/json' \
    | jq -r '.log_lines'
If you want to download all the logs (in order to provide information for a support ticket for instance) as a ZIP file, then it is possible to do this using the following command:
curl -L -X GET 'http://${APPLIANCE_HOST}:8080/v1/management/logs/zip' \
    -H 'Accept: application/json' \
    -o ./speechmatics.zip
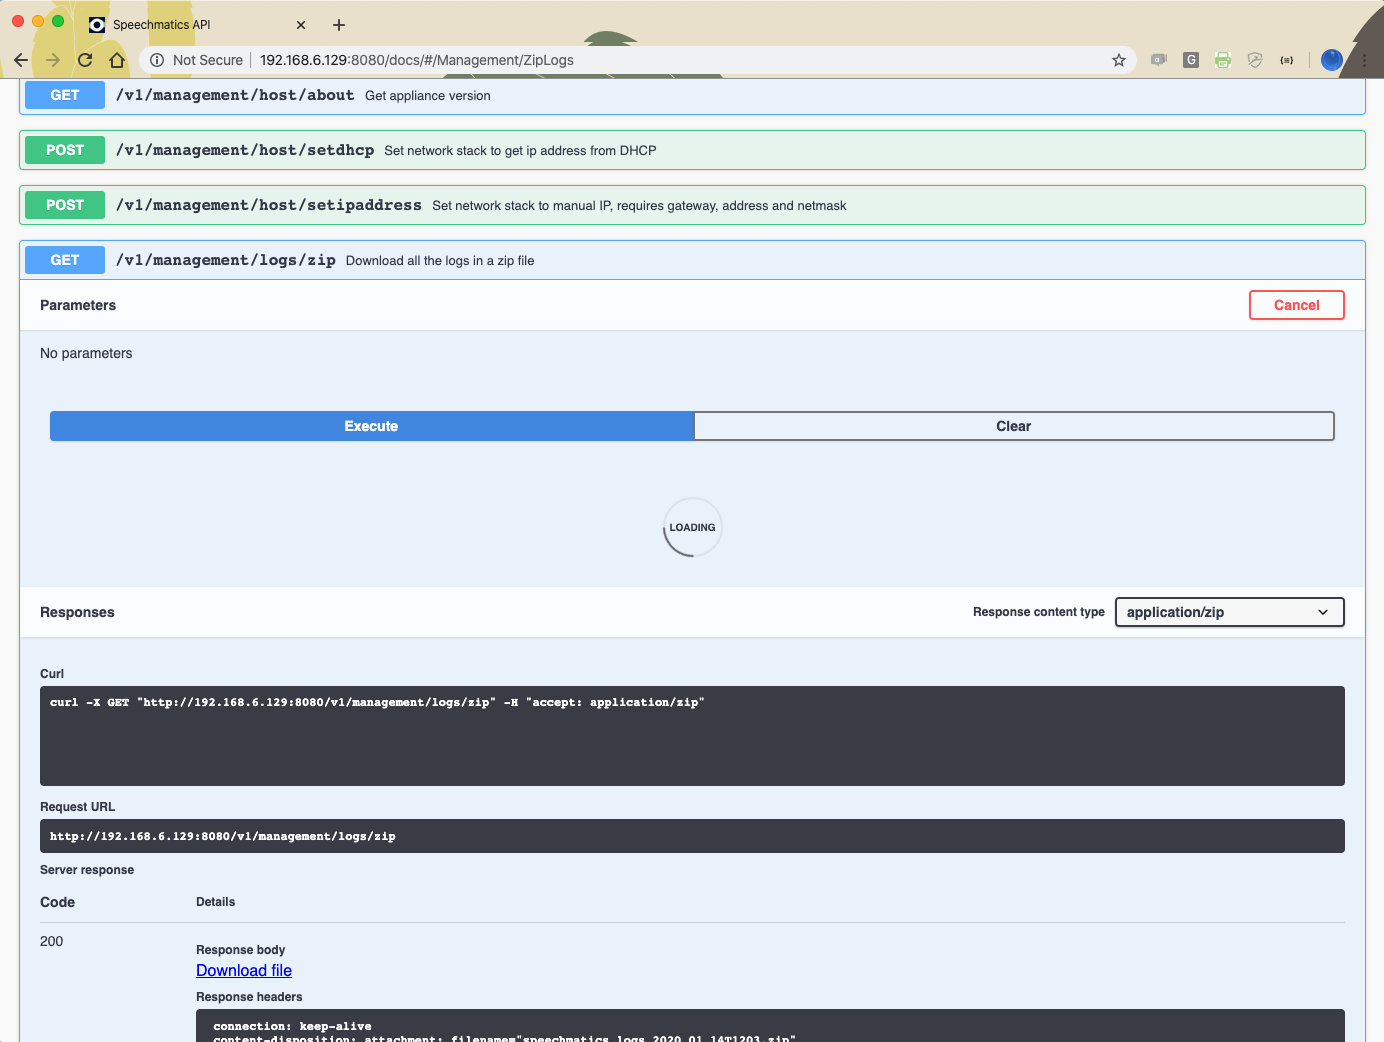
It is also possible to do this directly from the Swagger UI by entering in the following URL to your browser: http://${APPLIANCE_HOST}:8080/docs/#/Management/ZipLogs, and then clicking on the download link when the ZIP file is ready.

System restart
If the virtual appliance becomes unresponsive, there might be a need to restart it. If this is the case, it's recommended that the system is restarted through the management API, like this:
curl -L -X DELETE 'http://${APPLIANCE_HOST}:8080/v1/management/reboot'
If the Management API is not available, then you should reboot the appliance from the hypervisor console. For further information on how to restart the virtual machine via the console, please follow the manufacturers advice.
Troubleshooting
There may be times unexpected behavior is observed with the Real-time Virtual Appliance. If this is the case the following should be performed/checked:
- Check the license is valid (see licensing)
- Check the worker services are running
- Check the resources (CPU, memory & disk) to ensure they are not exhausted
- Restart all the services
- Restart the virtual appliance
- Collect logs and contact Speechmatics support: support@speechmatics.com.
Transcription job failure
If your transcription job fails with an error job status, more information can be found by looking at the logs from the jobs container (using the Management API, as previously described). Search the logs for the job id corresponding with your failure. If you see a SoftTimeLimitExceeded exception, this indicates that the job took longer than anticipated and as such was terminated. This is typically caused by poor VM performance, in particular slow disk IO operations (IOPS). If issues persist it may be necessary to improve the disk IO performance on the underlying host, or you may need to increase the RAM available to the VM such that memory caches can be taken advantage of. Please consult the section above on Host requirements, and the optimization advice specific to your hypervisor to ensure that you are not over-committing your compute resources.
Illegal instruction errors
If jobs fail repeatedly and you see Illegal instruction errors in the log information for these jobs then it is likely that the host hardware you are running on does not support AVX. The host machine requirements for the Real-time Virtual Appliance must meet the following minimum specification: Intel® Xeon® CPU E5-2630 v4 (Sandy Bridge) 2.20GHz (or equivalent). This is important because these chipsets (and later ones) support Advanced Vector Extensions (AVX). The machine learning algorithms used by Speechmatics ASR require the performance optimizations that AVX provides.
You can check this by looking in the management log when the appliance starts up. If you see a message like this:
2019-03-26 16:53:07,136 sm_management.app ERROR Processor not AVX capable. Tensorflow language models cannot run.
Then it means that your host's CPU does not support AVX, or that your hypervisor does not have AVX support.
A console is available to help with advanced troubleshooting in the event that the Management API is unavailable. It is described in the next section.
Console for Advanced Troubleshooting
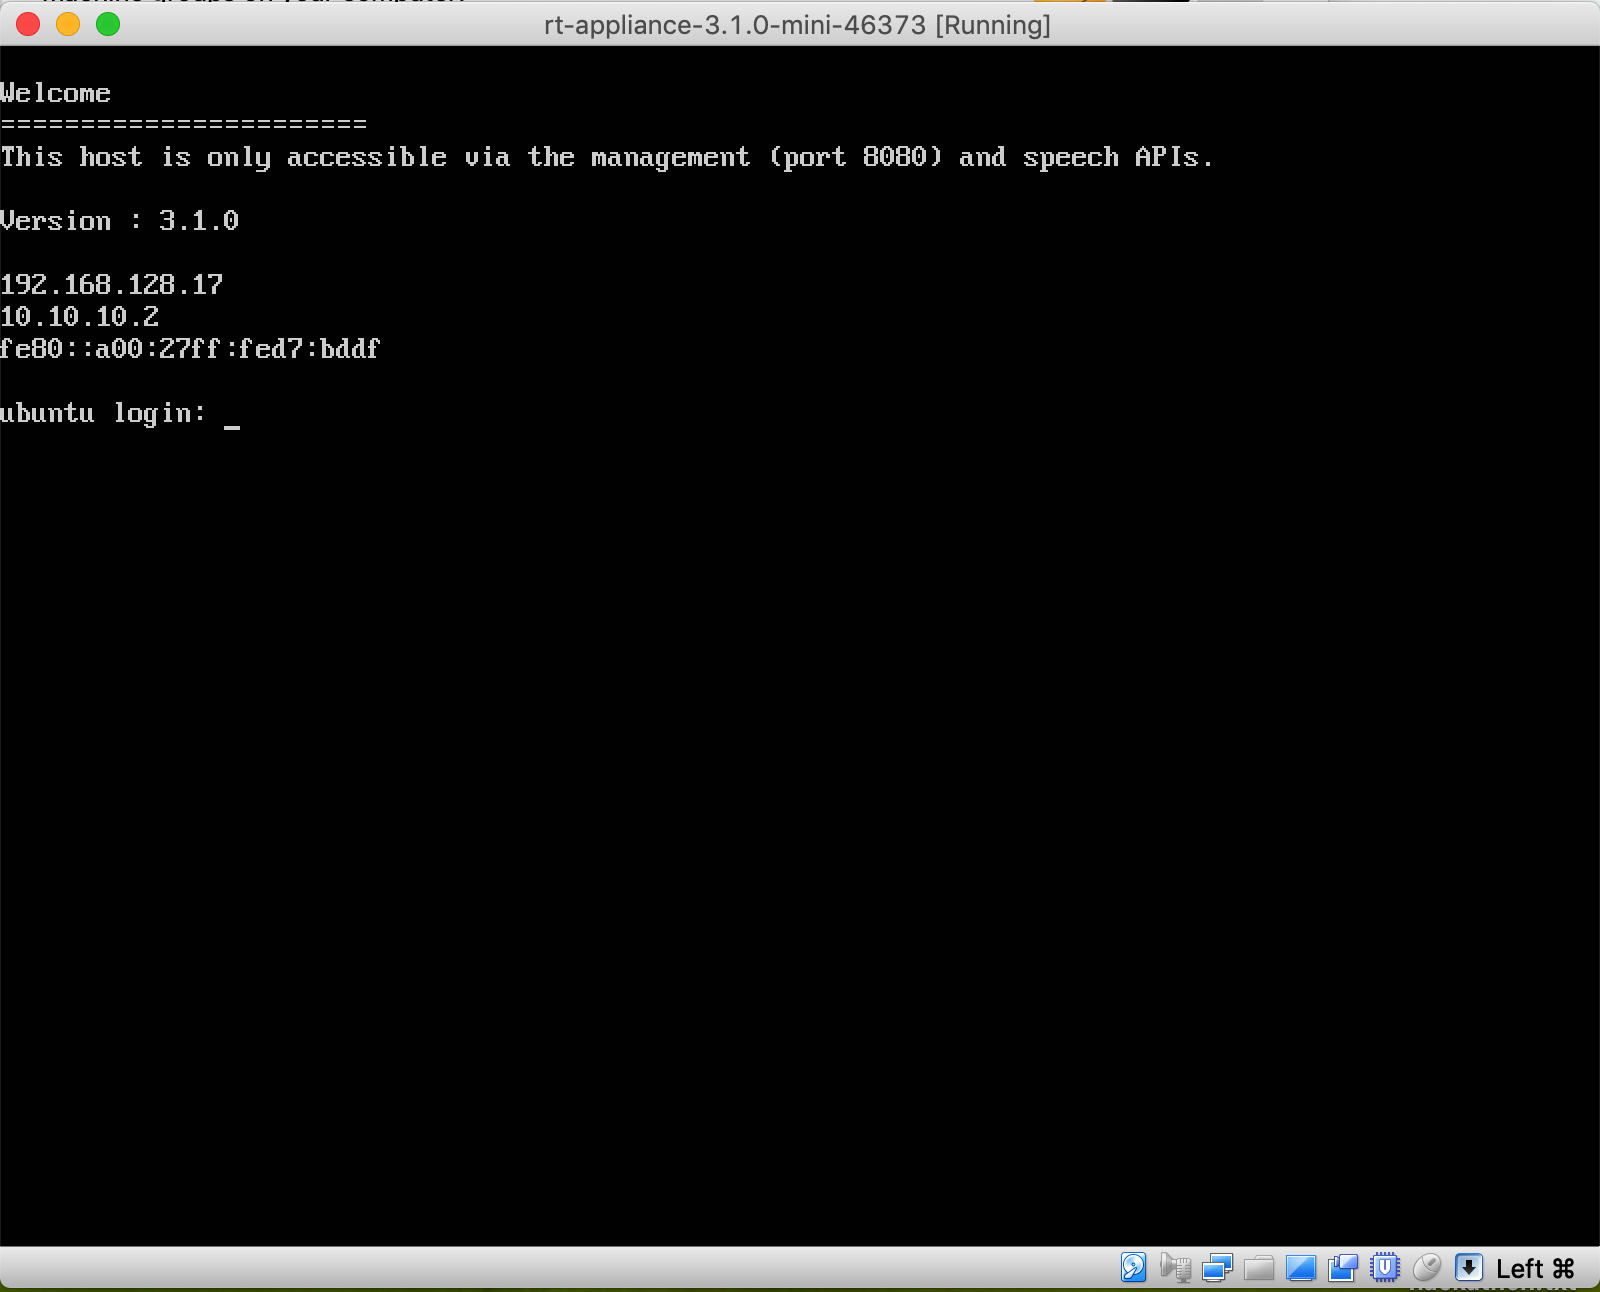
In the event that the Management API is unavailable (it is unresponsive, or there is no network connectivity) you can use the console to restore network connectivity, restart the appliance, or view information about services. To use this you need to use your hypervisor's GUI to access the logon screen for the appliance.

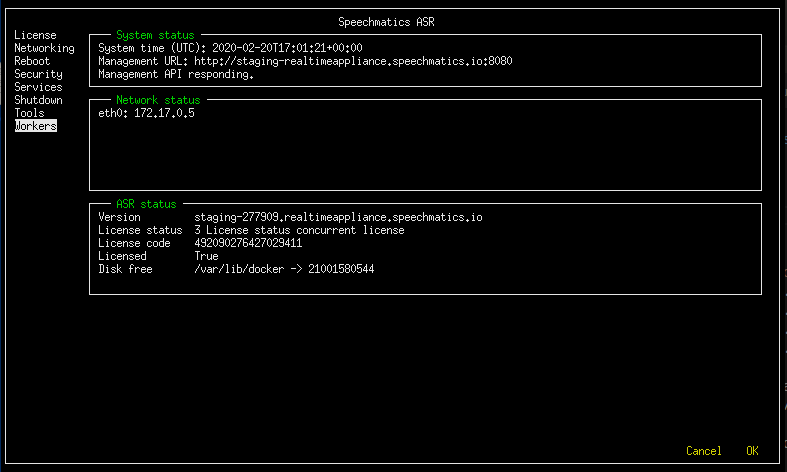
From this screen use the CTRL+ALT+F5 key combination to get to the console. Once you are in the console you have the following menu options available:
- License
- Networking
- Reboot
- Services
- Shutdown
- Tools
- Workers

The home screen shows high-level information about the appliance: IP addressing, software version and license status.
In the System status panel the API responding indicator shows the state of the Management API. Network status shows the IP address the appliance is currently configured with, and ASR status shows the license state and available storage space on the appliance.
In the event that you need to provide information to Speechmatics support you may be asked to connect to the console and provide this information. This section provides some tips on how to use the console to perform basic troubleshooting yourself.
Note: We recommend that you use the Management API for most troubleshooting tasks as it is easier to use. The console can be used in the event that the Management API is unavailable, but it does not provide all the features of the Management API.
License
The Licensing Troubleshooting section provides detailed instructions on how to use the Management API to resolve common licensing issues. If you cannot use the Management API then you can still use console to check the license status and perform basic licensing steps.
Networking
You can use the networking option to configure a static IP address, or use DHCP.
Reboot and Shutdown
Reboot and Shutdown options exist to allow you to restart or shutdown the appliance from the console. You will be asked to select OK to confirm.
Security
From this menu you can manage the security settings on the appliance, such as disabling HTTP access, changing the admin password for HTTP basic authentication, and resetting the SSL configuration.
Services
From this menu you can access the list of services that are running on the appliance. Selecting a service shows the log entries for that service.
Tools
This menu allows you to access a number of useful Unix utilities that can be used for advanced troubleshooting. In order to help progress a support ticket you may be asked to provide the output (ie. a screenshot) from running one of these commands.
Workers
This allows you to view and change the maximum number of workers allowed to run concurrently.